
Measuring Event ROI: A guide to getting the most out of your events
Last updated on: August 21, 2026
I was sitting in a post-event debrief, ready. Dashboard open, numbers prepared, the whole reporting deck built out for leadership. This was a flagship event. I had pipeline figures, contribution margin, cost analysis. I was proud of it.
Before I could get up to take the room, the CEO spoke first. “That was such a great event!” Nods around the table. “Joe, our top client, he was so happy. I saw him laughing, talking with people. It was super.” More agreement. Yes, super event. And then: “I don’t know, but we changed the caterer this year, didn’t we? The roast beef was so good. Everybody came up to me and told me how good the roast beef was.”
And then came his question: “So should we keep the same timing next year, or move the date? Some people had trouble coming, it was just before Easter.”
This is where I knew I could throw away my reporting deck. The decision had already been made. Nobody in that room had any idea what value the event brought. But it had good roast beef, so it could happen again next year.
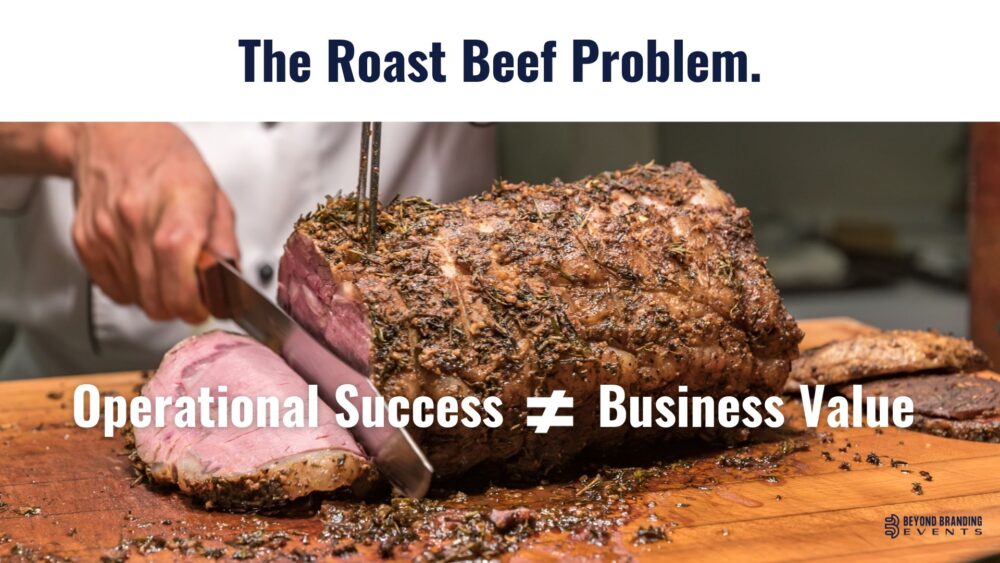
That moment stuck with me because it captures something the event industry still hasn’t solved. The distance between what event teams measure and what leadership uses to make decisions is enormous. And in that gap, decisions get made on vibes, on catering quality, on whether the CEO’s favorite client had a good time. That really awesome roast beef does not mean the event was worth the investment.
Activity metrics are not business value
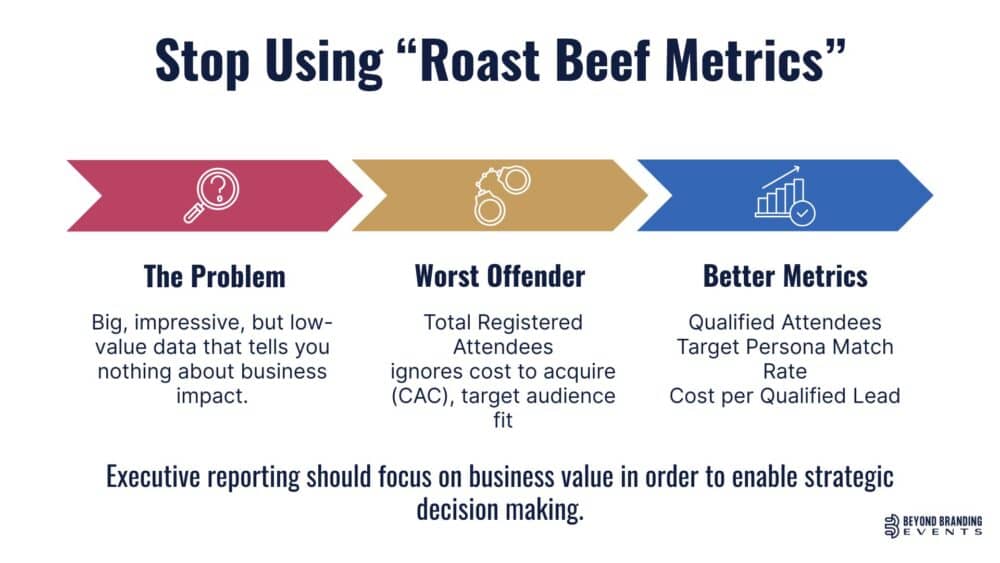
“200 attendees last year, 250 this year.” I hear some version of this in almost every debrief I sit in on. And it tells you exactly one thing: more budget was spent. It doesn’t tell you whether the right people were in the room, whether pipeline moved, whether a single target account got closer to a decision. Attendance went up. So what?
Headcount, satisfaction scores, NPS, how good the AV was, how smooth the registration process ran. These are all operational success metrics. They tell you the event happened successfully. Important, yes. But they don’t tell you it was worth the investment. They’re roast beef metrics.
The industry is drowning in this kind of data. Activity data. Data that answers “what did we do?” instead of “what did it cause?” And the problem isn’t that teams don’t work hard enough at measurement. The problem is that nobody is stepping back to define what success actually looks like before the first attendee walked through the door. What I mean is: indicators that the event was a successful business investment, however that looks for your company.
Are the right people in the room?
If there’s one metric that crosses every context in events, it’s what I call the Audience Quality Index, or AQI. It answers a deceptively simple question: are the right people in the room?
At the end of the day, that’s what we’re selling. We’re selling the room. To sponsors, to attendees, to speakers. And the question that matters isn’t how many people showed up. It’s whether the people who showed up are the ones who can actually move something for your business.
Here’s an example that makes this concrete. An executive event costs roughly $500 per person to deliver. Sales really wants to hit the attendee target, so they invite friends, junior contacts, anyone who fills the room. Cost-per-attendee looks perfectly fine on the report. But the right people aren’t there. The decision-makers who could actually move deals forward are outnumbered by seat-fillers. Volume looks good. Value isn’t there.
AQI isn’t just about job titles, either. It’s audience and intent. Are the right people at the right buying stage, in the right frame of mind? Someone at the top of the funnel who’s just learning about your space needs different content than someone at the bottom who’s actively comparing vendors. If you have a room full of early-stage learners at an event designed for late-stage decision-makers, your AQI is low no matter how impressive the attendee list looks on paper.
This is the metric I come back to with every client, regardless of whether they’re on the brand side, the agency side, or running an association. If you get the room right, most other things follow. If you don’t, it almost doesn’t matter how good the roast beef is.

You can't measure what matters if you don't know what matters
Measurement is Step 2 in my three-step model: Align, Measure, Optimize. And the order matters. Teams that jump straight to dashboards and attribution models almost always struggle, because they skipped alignment.
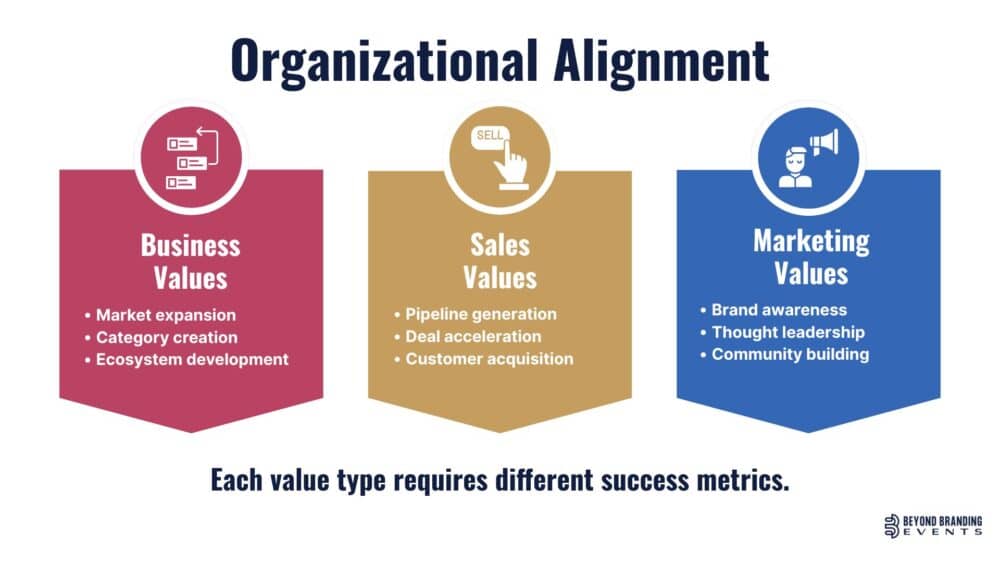
Strategic alignment means sitting down with leadership and getting clear on what the business actually needs from its events. Not the distilled version that gets passed down through three layers of management. The real priorities. Where is the business heading in the next one, three, five years? What does success actually look like at the portfolio level?
Once alignment defines the priorities, the measurement framework answers the real questions. What does ROI mean for your organization? (And by the way, ROI is only one of several return metrics. The distinctions between ROI, ROE, and ROO are worth understanding before you commit to chasing a single number.) How do you attribute event touchpoints across a customer journey that might involve dozens of interactions? Who is responsible for measuring what, by when? And how do you report it so leadership actually reads it?
That’s a measurement framework. It’s not a dashboard or a template someone downloaded. A deliberate system built from what matters to your business, designed to answer the questions your leadership is actually asking.
The attribution problem we're not talking about enough
Modern B2B buyers have 26 or more touchpoints before they make a purchasing decision. Your event might be touchpoint 8 and touchpoint 15 but the deal closes three months later, after a sales call. So who gets the credit?
I explain attribution with a train journey. First-touch attribution credits where the passenger boarded. Last-touch credits where they got off. Both approaches make everything that happened in the middle invisible, where events usually live. The conference where the prospect met your product team for the first time, the VIP dinner where the relationship deepened, the roadshow where they saw a live demo. All of it disappears if you only credit the first click or the last handshake.
Time-based, multi-touch attribution is the approach that makes events visible in the pipeline. It distributes credit across touchpoints based on when they happened and how close they were to key conversion moments. It isn’t perfect, no attribution model is. But it’s dramatically better than pretending events either caused the whole deal or none of it.
Attribution windows matter here, too. Not every event type influences at the same pace. Field events and product launches typically show impact within 14 to 30 days. Conferences and industry events have a longer influence window, 30 to 90 days, because the relationships they build take longer to convert. VIP executive events can move fast or slow depending on the deal stage, so 7 to 60 days. Digital events tend to compress, 7 to 45 days. Setting the right attribution window for each tier of event makes the difference between capturing event influence and completely missing it.

Report what you caused, not what you did
The single biggest mistake I see event teams make is reporting on what they did instead of what they caused.
Activity language sounds like this: “We had 1,200 attendees, up 10% year-on-year. The house was full.”
Investment language sounds like this: “Event X delivered $1.5M in projected pipeline but was capacity-constrained by venue size. An additional $50K would scale the venue, raising pipeline potential to $2.5M.”
One makes you sound like an event planner. The other makes you sound like a strategic advisor. Leadership won’t learn the language of events. They don’t need to. The job of the event professional is to translate, to become bilingual. Speak events with your team, speak business with the boardroom. We’re talking about profit efficiency. Market expansion. Strategic alignment. Pipeline influenced per dollar spent. These are the terms that help defend the budget, not “we had great attendance and positive feedback.”
Let’s think about it this way: A quarterly report that lists every event with dates and satisfaction scores gives leadership nothing to decide on. No cost, no revenue, no pipeline, no strategic alignment, no recommendation. I’ve seen those reports (heck, I’ve been guilty of writing them). They check the box of “we reported,” but they don’t move anything forward. Compare that to: “The content at Event Y drove a 20% higher retention rate for the follow-on subscription, justifying it as a strategic loyalty investment, unlike Event Z, which showed no retention impact.” Now you haven’t just told leadership what happened. You’ve told them what it caused, and compared it to something that didn’t work. That’s investment language.
This shift is the difference between filing a report and influencing a decision. Leadership doesn’t care about how many people came. They care about what those people generated.
What a scored event actually looks like
Theory is useful. But I find people understand measurement much better with a worked example, so here’s one. This is a fictional teaching scenario, not a real client, but the math and the method are exactly what I use.
Let’s take a flagship summit with 500 attendees, $150,000 total cost, $2 million in influenced pipeline, 85% attendee satisfaction.
Those numbers on their own are interesting but incomplete. Context is what makes them useful. That $2 million represents 20% of the total $10 million portfolio pipeline for the year. Last year’s edition of the same summit influenced $1.5 million, so that’s a 33% increase year-on-year. That tells you something.
Now the metric I love: cost per dollar influenced. $150,000 divided by $2 million equals 7.5 cents. Flip it around: for every dollar spent, this event influenced roughly $13 in pipeline. You can tell the digital team to eat that!
Score it across business impact and strategic alignment, plot it on the Performance Quadrant and this event lands firmly in Grow. The full scoring methodology is covered in the Event Portfolio Mastery workshop replay.

ROI is not a strategy
Here’s where my conviction is a bit controversial. Chasing ROI is not event strategy. It’s just one number. It tells you something, but not nearly enough.
Reporting “we had an ROI of X” to leadership tells them almost nothing about what to do next. It doesn’t tell them whether to grow that event, transform it, optimize it, or divest it. It doesn’t tell them how it compares to the rest of the portfolio. It doesn’t tell them whether the right people were in the room or whether the event is aligned to where the business is heading next year.
The Performance Quadrant does. The measurement framework does. ROI alone does not.
It makes me sad to see teams chasing ROI as if it’s the finish line. It’s not. It’s just one data point in a much larger picture. And when it becomes the only number you report, it actually makes it harder to have strategic conversations with leadership, because you’ve reduced a complex, multi-dimensional investment to a single ratio.
Forrester’s Q1 2026 events survey found that 50% of organisations say their events perform well, but only 38% of CMOs agree. And that’s because the way many teams report on events doesn’t connect to the questions leadership is asking.
Stop measuring the roast beef
That CEO in the debrief wasn’t wrong to be happy about the event. He was wrong to make a strategic decision (e.g. hosting the event again next year) based on catering feedback and vibes. And that’s not entirely his fault, he wasn’t used to getting event insights that he could make impactful decisions with.
That’s the job. Not just running great events, but building the measurement systems that connect those events to business outcomes. So that the next time leadership asks “should we do this again?”, the answer comes with pipeline data, audience quality scores, cost efficiency ratios, and a clear recommendation based on where the event sits in the portfolio.
Measurement serves decision-making, not reporting. The goal is better decisions, not better dashboards.
Stop measuring the roast beef. Start measuring what your portfolio is doing for the business. And if you want to see where your programme stands today, start with the portfolio assessment.

FAQ
Q1. What is the difference between activity metrics and business value metrics for events?
Activity metrics tell you the event happened successfully: attendance, satisfaction scores, registration numbers, NPS.
Business value metrics tell you the event was worth the investment: pipeline influenced, deal acceleration, audience quality, cost per dollar influenced.
The distinction matters because activity metrics answer "what did we do?" while business value metrics answer "what did it cause?" Reporting 250 attendees tells leadership that budget was spent.
Reporting $2 million in influenced pipeline at 7.5 cents per dollar tells them what that budget produced. Both have a role in event management, but only business value metrics connect to the strategic decisions leadership needs to make about where to invest next.
Q2: What is the Audience Quality Index (AQI) for events?
The Audience Quality Index measures whether the right people are in the room, not just how many showed up. It evaluates audience composition beyond job titles, looking at whether attendees are at the right buying stage, in the right frame of mind, and able to move something for the business.
For example, an executive event costing $500 per person might hit its headcount target, but if sales invited more junior contacts to fill seats, the decision-makers who could actually advance deals are outnumbered by seat-fillers. Volume looks good on paper but value isn't there. AQI is the metric that makes this gap visible.
Q3: How do you attribute event ROI when buyers have dozens of touchpoints?
Time-based multi-touch attribution distributes credit across touchpoints based on when they happened and how close they were to key conversion moments.
This matters because single-touch models - whether first-touch or last-touch - make everything in the middle invisible, and events usually live in the middle.
The attribution window also varies by event type: field events and product launches typically show impact within 14 to 30 days, conferences within 30 to 90 days, VIP executive events within 7 to 60 days, and digital events within 7 to 45 days. Setting the right window for each tier is the difference between capturing event influence and missing it entirely.
Q4: How should I report event ROI to leadership?
Report what your events caused, not what they did. Replace activity language ("1,200 attendees, up 10% year-on-year") with investment language ("Event X delivered $1.5M in projected pipeline but was capacity-constrained. An additional $50K would raise pipeline potential to $2.5M").
Include pipeline data, cost efficiency ratios, audience quality scores, and a clear recommendation tied to strategic priorities.
Compare events against each other so leadership can see which ones are delivering and which aren't. The goal is to give leadership something to decide with, not a list of what happened. Provide an analysis of what it produced and what to do next.
Q5: Do I need specialised software to start measuring event ROI?
No. Some of the best portfolio measurement frameworks are built in spreadsheets.
Start by pulling siloed data from your CRM, MarTech platform, and finance systems into one place and building dashboards manually. The tools follow the thinking, not the other way around.
As your portfolio matures, you can integrate event management software with your CRM and build basic attribution models. A data warehouse feeding Power BI or Tableau with predictive analytics is the advanced end. Very few organisations have reached that level of integration. The most common reason teams give for not measuring properly is that they don't have the right tools. It's usually a data clarity problem, not a technology problem.